FITEVAL

FITEVAL is program for objective assessment of model goodness-of-fit with statistical significance based on Ritter and Muñoz-Carpena (2013, 2020).
- Download FITEVAL GUI Installer for: Windows [1.7Mb] or macOS[5.6Mb]. Please see installation and troubleshooting instructions here.
- Download FITEVAL for Matlab [1.8Mb]
- Download FITEVAL example inputs [6kb]
- Library requirements (see below)
Click on the tabs below for the GUI or MatLab program documentation.
Program description
FITEVAL is a software tool for standardized model evaluation that incorporates data and model uncertainty following the procedures presented in Ritter and Muñoz-Carpena (2013, 2020). The tool is implemented in MATLAB® and is available free of charge as a computer application (MS-Windows® and macOS®) or as a MATLAB function. Among other statistics, FITEVAL includes the quantification of model prediction error (in units of the output) as the root mean squared error (RMSE); and the computation of the Nash and Sutcliffe (1970) coefficient of efficiency (NSE) and Kling–Gupta (2009) efficiency (KGE) as dimensionless goodness-of-fit indicators. FITEVAL uses the general formulation of the coefficient of efficiency Ej, which allows modelers for computing modified versions of this indicator,

where Bi is a benchmark series, which may be a single number (such as the mean of observations), seasonally varying values (such as seasonal means), or predicted benchmark values using a function of other variables. For j=2 and Bi=Ō , Ej yields de classical E2=NSE. The code is flexible to be used with other model efficiency threshold values than those proposed, or for calculating Legates and McCabe (1999) modified form of the coefficient of efficiency (E1) instead of NSE. Notice that using transformed series in the corresponding ASCII text input file, such as {√Oi,√Pi} , {ln(Oi + ε). ln(Pi + ε)} or {1/(Oi+ ε), 1/(Pi + ε)}, the program computes NSE (and RMSE) applied on root squared, log and inverse transformed values, respectively (Le Moine, 2008; Oudin et al., 2006).
Hypothesis testing of NSE exceeding a threshold value is performed based on obtaining the approximated probability density function for Ej by bootstrapping (Efron and Tibshirani, 1993) or by block bootstrapping (Politis and Romano, 1994) in the case of time series (non independent autocorrelated values). In order to rate the model performance based on NSE (i.e. E2), the following threshold values are used for delimiting the model efficiency classes or "pedigree": NSE<0.65 (Unsatisfactory), 0.65≤NSE<0.80 (Acceptable), 0.80≤NSE<0.90 (Good) and NSE≥0.90 (Very good). If other model efficiency thresholds for particular applications could be justified, these can be changed in FITEVAL (see Configuration options). Statistically accepting model performance (i.e., when the null hypothesis NSE<0.65 is rejected) implies that the one-tailed p-value is below the considered significance level α. This p-value quantifies the strength of agreement with the null hypothesis. Thereby, for p-value >α, the model goodness-of-fit should be considered Unsatisfactory. Usual values of α are 0.1, 0.05 or 0.01 and its choice will depend on the context of the research carried out. That is, how strong the evidence must be to accept or reject the null hypothesis (NSE< 0.65). As a starting point, the least restrictive significance level (α= 0.10) can be adopted (Ritter and Muñoz-Carpena, 2013). In addition, the guidance on model interpretation and evaluation considering intended model uses provided by Harmel et al. (2014) can be taken into consideration.
For realistic model evaluation, consideration of uncertainty associated with the observations and the model predictions is critical. Two methods to account for measurement and/or model uncertainties are studied and implemented within FITEVAL: a) Probable Error Range, PER) that has the advantage that is non-parametric, but can yield excessive model performance increases; and b) Correction Factor (CF) provides more realistic modification of the deviation term used in the goodness-of-fit indicators and allows for model uncertainty, but it requires assumptions about the probability distribution of the uncertainty about the data and/or the model predictions. FITEVAL provides modelers with an easy to use tool to conduct model performance evaluation accounting for data and prediction uncertainty in a simple and quick procedure.
Program Use & Output
FITEVAL can be executed as a MATLAB function. A user supplied input ASCII data file is required, located in the same directory as the application. By default, this file name is "fiteval.in", but the user can specify an arbitrary file name passed in the command line, i.e.,
fiteval
fiteval data_ex1.in
The first line will execute with the data contained in the fiteval.in file located in the distribution directory. The second command above will read the contents of the user specified file ("data_ex1.in" in the example). See additional details about program execution in the Examples section below.
Input data file
The input data file (fiteval.in by default or a filename given in the command line as shown above), must contain at least two paired vectors or columns,
{observations, predictions [...]}
The input file may contain missing values that must be denoted as "nan". The program can handle many additional options (comparisons with benchmark data, uncertainty in observed values, uncertainty in the simulated results and combinations of these) by specifying additional columns in data input file and line 9 of the fitevalconfig.txt file (described below). See the help file (fitevaloptions_help.pdf), and corresponding input file examples provided in the distribution directory.
Outputs description
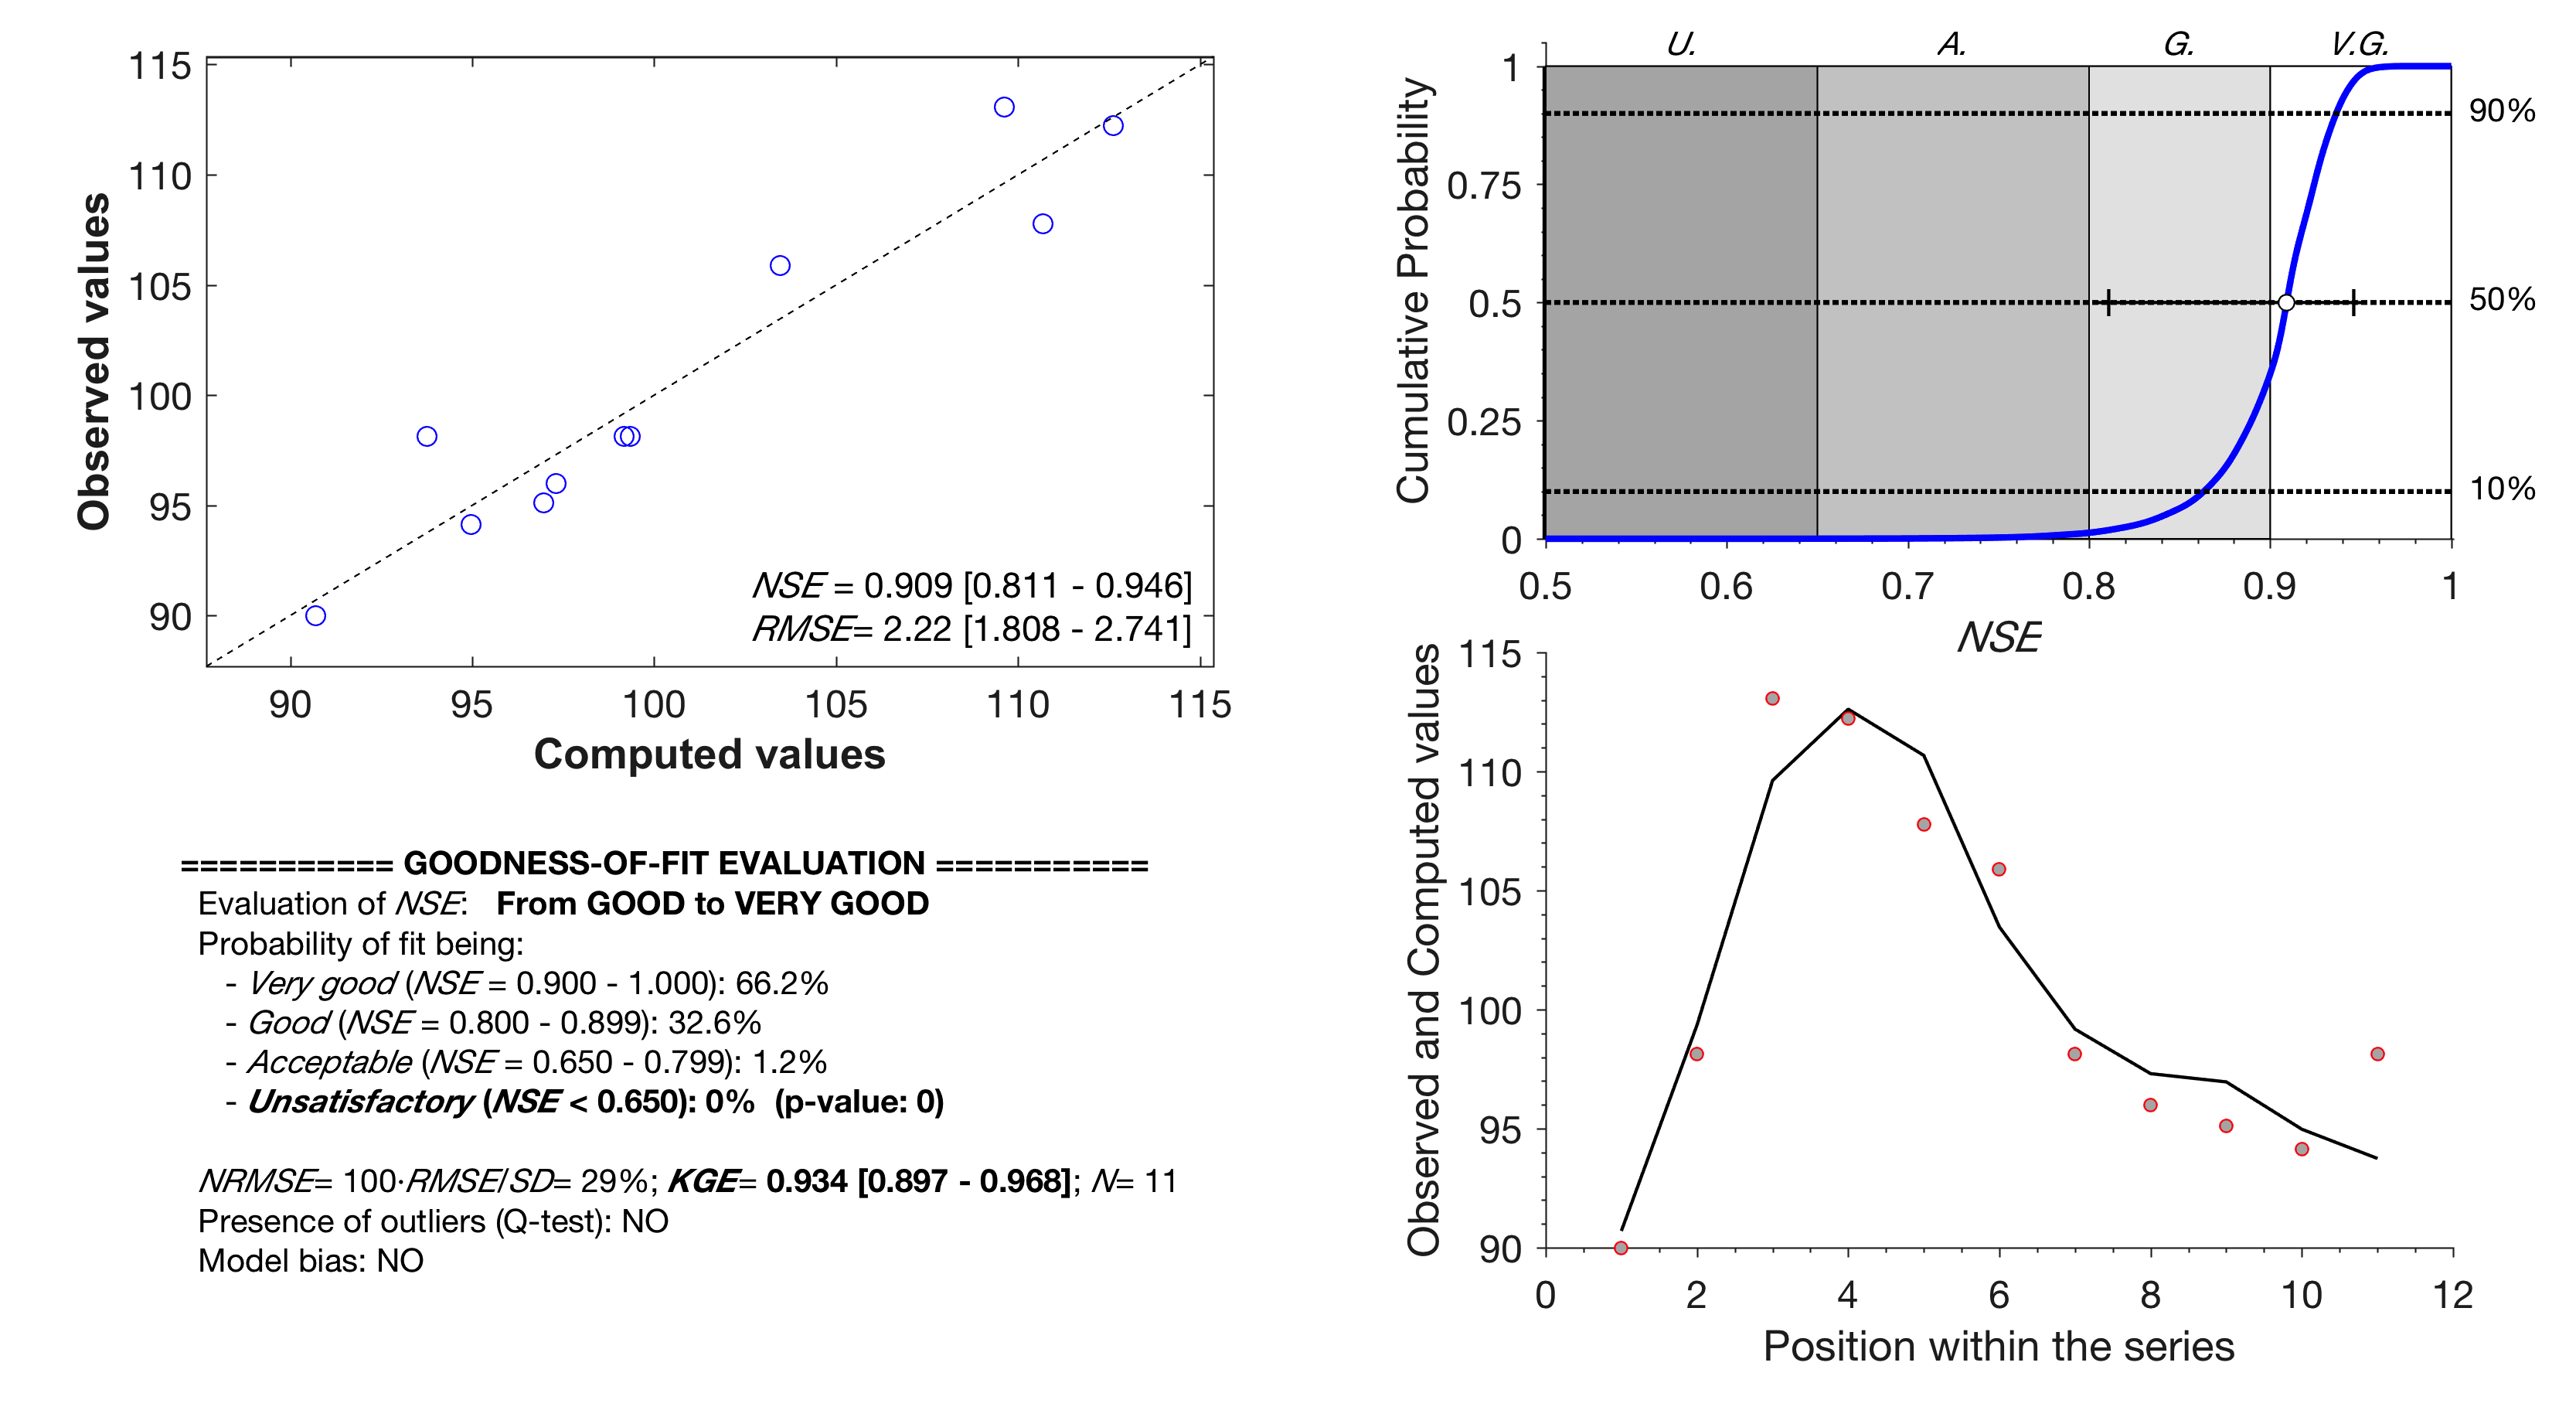
After execution the program presents a summary of statistics and a composite figure with the graphical assessment. The goodness-of-fit evaluation results are also provided in a portable data file (pdf) and a portable network graphics file (png) with the same name as the input data file, written to the same directory where initial .in file is located. The screen output and pdf files contain the following information:
a) plot of observed vs. model computed values illustrating the match on the 1:1 line;
b) calculation of NSE and RMSE and their corresponding confidence intervals of 95%;
c) plot of the approximated NSE cumulative probability function superimposed on the NSE "pedigree" regions;
d) plot illustrating the evolution of the observed and computed values;
e) qualitative goodness-of-fit interpretation based on the model "pedigree" classes (Acceptable, Good and Very Good);
f) p-value representing the probability of wrongly accepting the fit (NSE≥ NSEthreshold=0.65);
g) model bias when it exceeds a given threshold (>5% by default);
h) possible presence of outliers;
i) normalized NRMSE (in %)= 100·RMSE/(standard deviation of the observations);
j) calculation of Kling–Gupta efficiency (KGE) and corresponding 95% confidence interval.
The 1:1 and series plots help to visually inspect the similarity degree of the two series, and detecting which observations are best or worst predicted by the model. When uncertainty is incorporated in the evaluation, he resulting 1:1 plot shows the uncertainty boundaries as vertical (measurement uncertainty) or horizontal (model uncertainty) error bars, whereas the series plot shows both as vertical error bars. Additionally, the numerical output is stored in a ASCII text file with the same name as the input data file and extension '.out'.
The plots can be obtained also as separated files in the specified (as argument) graphic format ('eps', 'pdf', 'jpg', 'tiff, or 'png'). A plot label can be provided by providing a "text string" as argument after the filename. Examples of use are provided in the section below.
Removing repeated cases in the observed and calculated values is possible by passing as second argument NOREP. The program indicates the number of removals only if repeated cases present (see examples below.
Configuration file
The fitevalconfig.txt file is required when you want to run FITEVAL with other threshold values or for calculating Legates and McCabe (1999) modified form of the coefficient of efficiency (E1) instead of NSE. This file contains six lines specifying: Acceptable NSEthreshold, Good NSEthreshold, Very good NSEthreshold, relative bias threshold value (%), the option for computing E1, and figures’ font size, the resolution of the saved figures (in dots per inch), and the option for canceling the on-screen display of the graphical output (useful when using FITEVAL for multiple series calculations within Matlab or other scripting environments). The corresponding default values are 0.65, 0.80, 0.90, 5, 0, 10, and 0, respectively. FITEVAL can also apply Efron and Tibshirani (1993) bootstrap or Politis and Romano (1994) block bootstrap when dealing with time series. The latter is recommended for autocorrelated values like is typical in time series and is set as the default option. An example of the fitevalconfig.txt file is provided below. .
0.65 %Acceptable NSE threshold value 0.80 %Good NSE threshold value 0.90 %Very good NSE threshold value 5 %BiasValue 0 %Compute Legates and McCabe modified NSE (1=yes,0=no) 0 20000 % Bootstrap method (1= Efrons' or 0= block; Nr of resamples) 10 % FontSizeValue 0 % Do not display graphical output (1=accept) 0 % Take into account observations uncertainty (>0,1,2,3 or 4= yes) ro % Color and symbol of the series marker 4 % Size of the series marker |
To find different combinations of markers and colors that can be used in MatLab, please visit http://www.mathworks.com/help/matlab/ref/linespec.html for full description of options. For example, "ro" in the example above means "red circle" marker.
Running FITEVAL without consideration of uncertainty
Running a simple case
Several EXAMPLE files are included in this package (fiteval_1.in through fiteval_14s.in) and fiteval.in (default). The program input file must be written in ASCII or text format (be sure to select this option when saving the file with the editor of your choice). The program is executed from MatLab command line with the following syntax:
fiteval <argument_list>.
Some examples are presented below,
fiteval
fiteval fiteval.in norep
fiteval data_ex1.in
fiteval data_ex2.in
fiteval data_ex3.in
fiteval data_ex3.in norep
fiteval data_ex1.in "Example Data Set" jpg
Example of FITEVAL numerical and graphical output
>>> fiteval data_ex1.in

Outliers and model bias
Outliers (Dixon's test) and bias (with threshold set in the configuration file above) are automatically checked when running the program to guide the user in potentia sources of differences between observed and simulated values. Information for both tests is included in the graphical (filled symbols and annotated coordinates) and text outputs. And example is provided below for the file fiteval.in (included in examples with the distribution),
fiteval fiteval.in
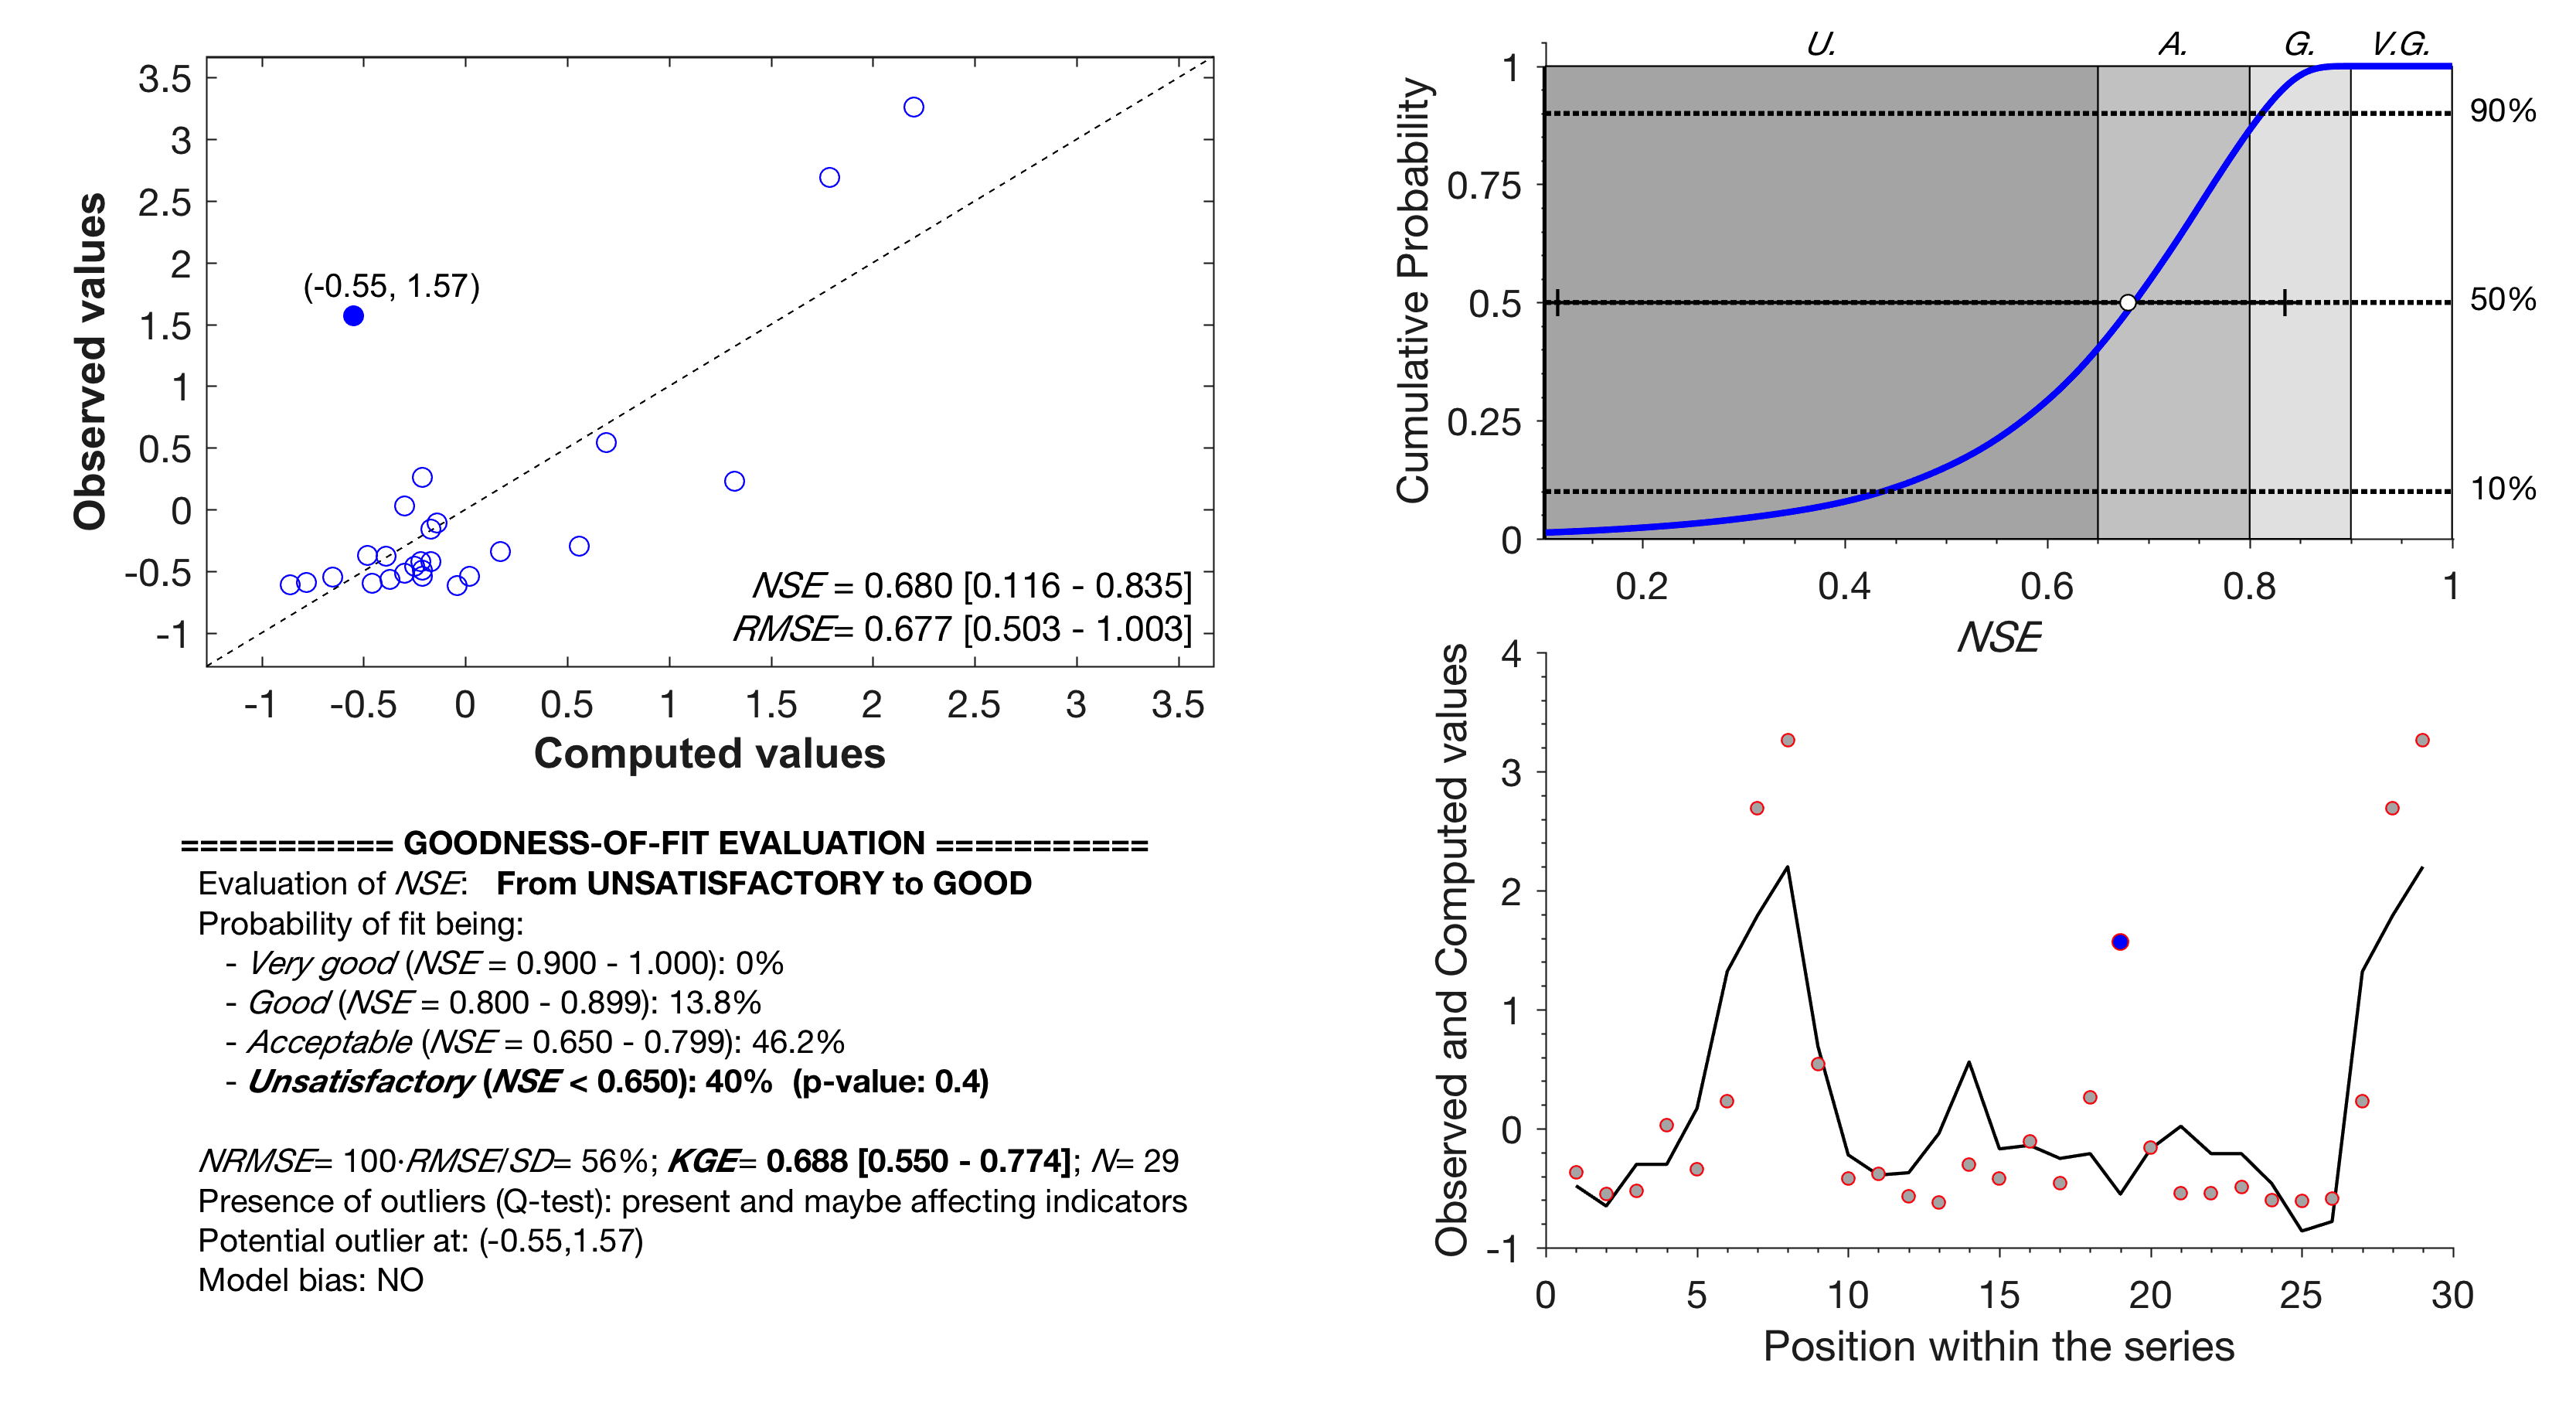
Notice that the specific outlier coordinates are provided also in the output text file,
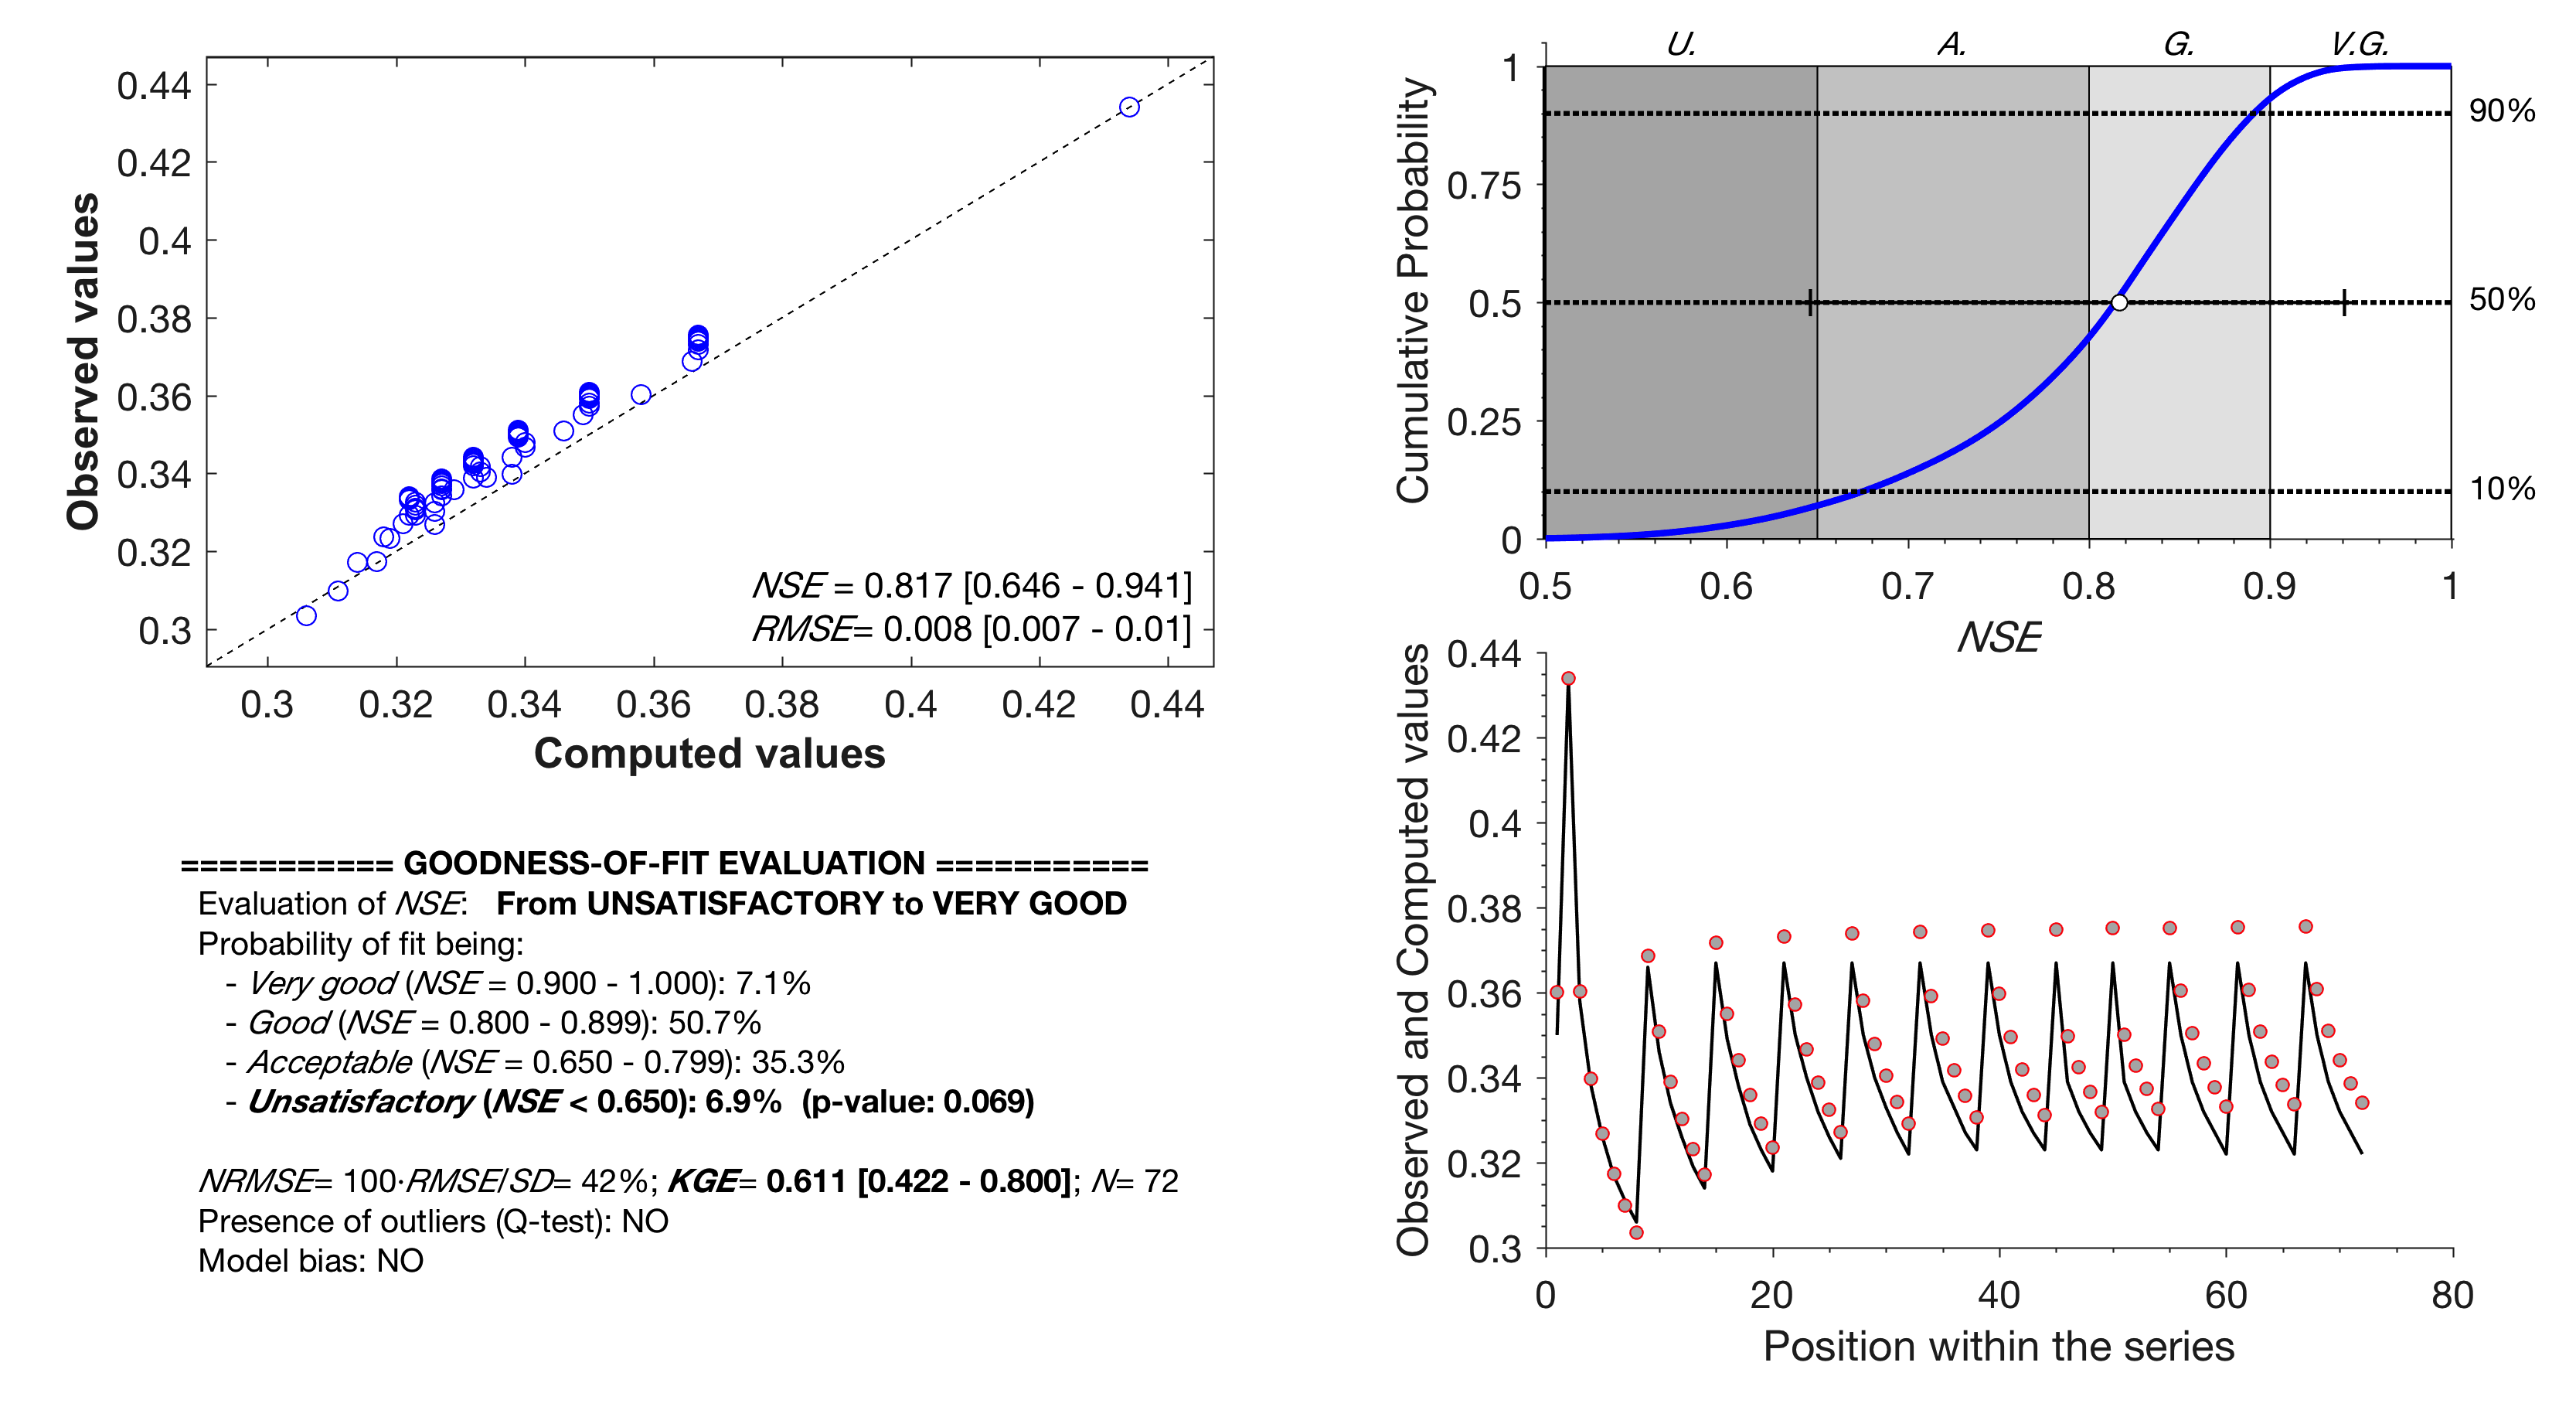
Checking effect of repeated values
fiteval data_ex3.in NOREP
=============== GOODNESS-OF-FIT EVALUATION ================
|
Batch processing of data files
Notice that a batch file can be used for executing many FITEVAL examples automatically (to avoid stopping the execution after each on-screen graphical output set the appropriate flag in the fitevalconfig.txt file).
An example batch processing file (run_all_examples.m) is included in the distribution package for running the example data files. This can be extended for any number of files and names.
Running FITEVAL accounting for observations and model uncertainty
Several options are provided in FITEVAL to consider uncertainty in observations and/or model outputs following Ritter and Muñoz-Carpena (2017) based on Harmel and Smith (2007) and Harmel et al. (2010). When selecting uncertainty several options are available controlled from the fitevalconfig.txt (see help file for details, fitevaloptions_help.pdf). Typically, to run these cases, a combination of an option value (>0-4) in line 9 of the file fitevalconfig.txt and number of columns in the input data file will be required.
IMPORTANT NOTES:
- Be careful to match the option value with the number of columns required (see help file for details, fitevaloptions_help.pdf) to produce the desired results.
- When running uncertainty cases the program will run twice, the first time with uncertainty and the second without uncertainty. Please compare both sets of results (PDF files generated in working directory, with and without "U" in file name).
A) Running FITEVAL accounting for uncertainty of observed data
To include uncertainty in observations when evaluating the model the user must provide the proper number of columns in the input data file and assign the case number on the configuration file: 0<PER<1, 1, 2, 3 (see help file for details, fitevaloptions_help.pdf).
For example, if the user desires to specify the error distribution from factor CF, UB_Omin, UB_Omax for every individual data point, line 9 in the fitevalconfig.txt file now becomes,
3 % Take into account observations/model uncertainty (>0,1,2,3 or 4= yes) |
and the input data file now requires 5 columns (Yobs, Ypred, CF, UB_Omin, UB_Omax - see file fiteval_9s.in examples and described in Case 9 of fitevaloptions_help.pdf).
Note that FITEVAL can also compute automatically the correction factors (CFi) and the uncertainty bounds based on the selected probability distribution according to the table in fitevaloptions_help.pdf. For example, the inputs can be simplified when a common error distribution is used for all data points. For example, in order to run FITEVAL accounting for observation uncertainty (Case 9 in fitevaloptions_help.pdf) described by a normal distribution with a coefficient of variation of 17% common to all data points, the following fievalconfig.txt file will be required.
0.65 %Acceptable NSE threshold value 0.80 %Good NSE threshold value 0.90 %Very good NSE threshold value 5 %BiasValue 0 %Compute Legates and McCabe modified NSE (1=yes,0=no) 0 20000 % Bootstrap method (1= Efrons' or 0= block; Nr of resamples) 10 % FontSizeValue 0 % Do not display graphical output (1=accept) 3 9 N 17 % Take into account observations/model uncertainty (>0,1,2,3 or 4= yes) ro % Color and symbol of the series marker 4 % Size of the series marker 300 % Resolution of figures in dpi |
The input data file now requires only 2 columns (Observed vs. predicted values). In this case FITEVAL will automatically compute the correction factor (CF) and upper and lower error bounds (UB_Omin, UB_Omax) for each observed value that are used to modify the goodness of fit indicators based on Harmel et al. (2010). For example, executing "fiteval fiteval_1.in" with the configuration above will produce the following result,

B) Running FITEVAL accounting for uncertainty of model results
Model errors like those generated from a Monte-Carlo uncertainty analysis, can be also considered (Case 13). For example, using the simplification of a common error distribution type for all predictions, for example a triangular distribution with bounds given as 10% lower and 20% up from the predicted value, line 9 in the fitevalconfig.txt file now becomes,
4 13 T 10 20 % Take into account observations/model uncertainty (>0,1,2,3 or 4= yes) |
and the fiteval.in file now requires only 2 columns (Observed vs. predicted values). For example, with this model error and using the example fiteval_1.in we obtain,
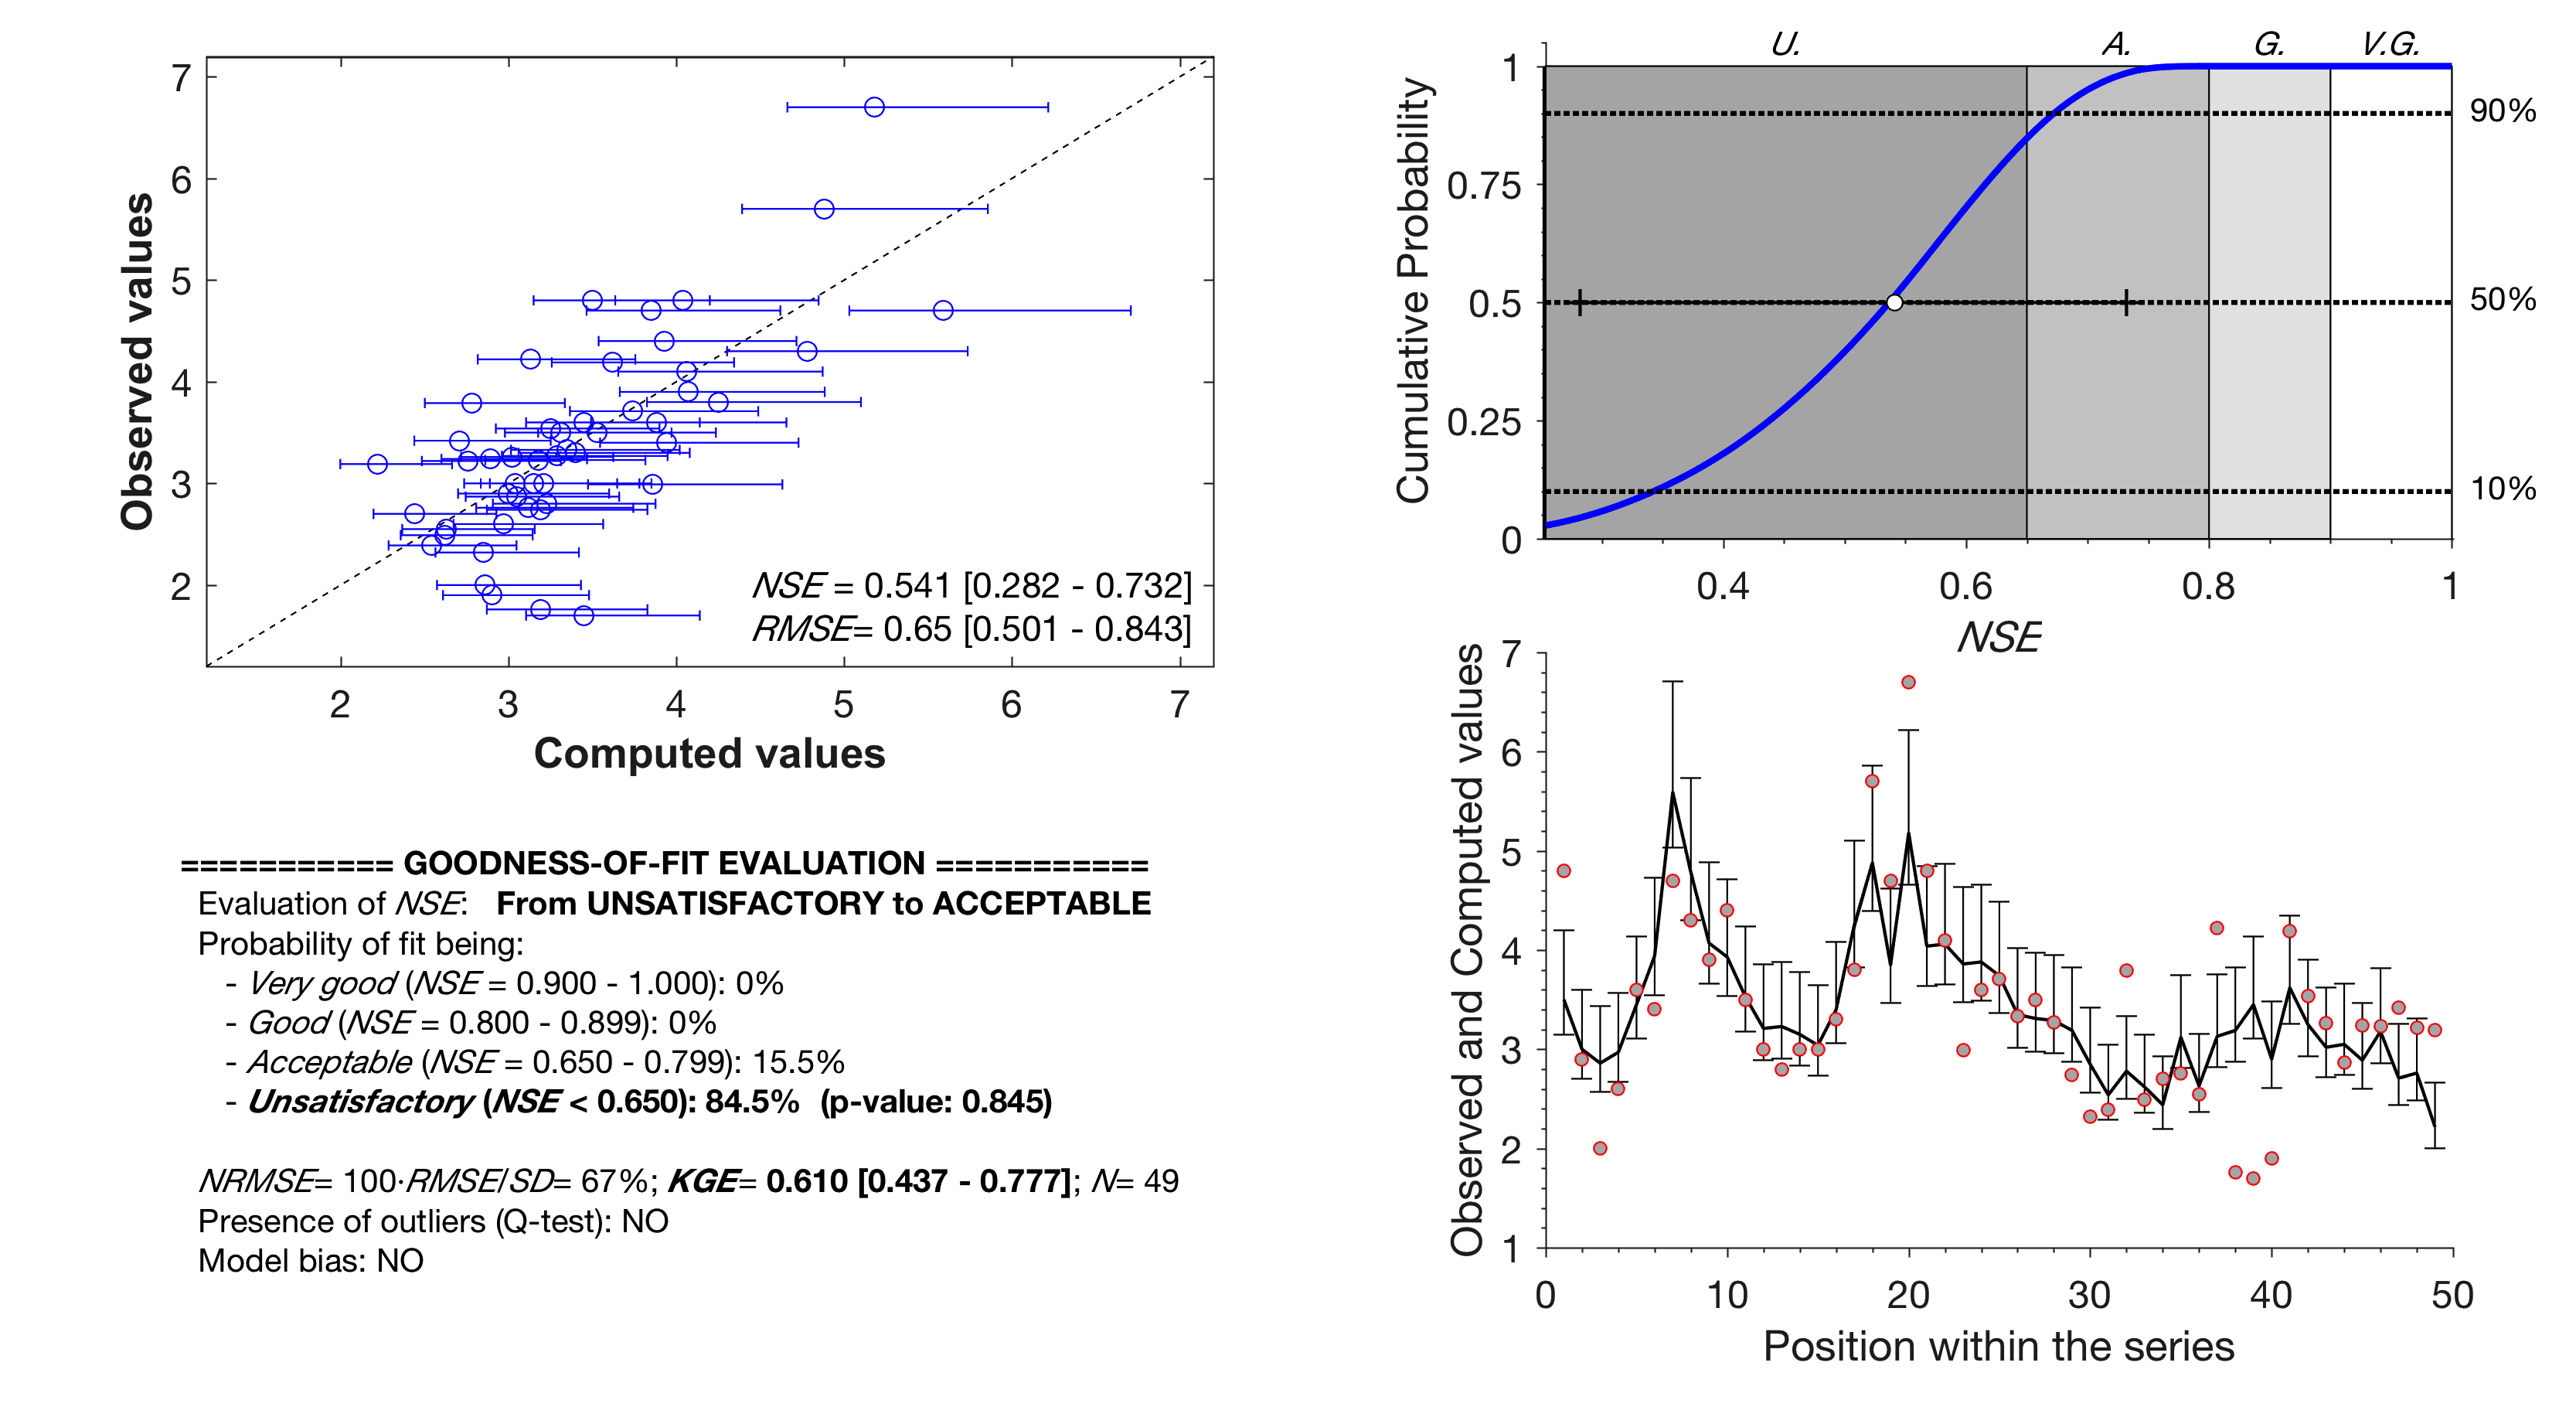
However, if individual distributions are desired for each predicted point, the default 5 columns for Case 13 will be used (Yobs, Ypred, CF, UB_Pmin, UB_Pmax - see file fiteval_13s.in examples) and line 9 in the fitevalconfig.txt file now becomes,
4 % Take into account observations/model uncertainty (>0,1,2,3 or 4= yes) |
C) Running FITEVAL accounting for both uncertainty of observed data and model results
Model uncertainty, like those generated from a Monte-Carlo uncertainty analysis, and observation uncertainty, can be also considered together in the evaluation (Case 11). In this case, as shown in the example input file fiteval_11s.in, the input file must now contain 7 columns corresponding to {Yobs Yprd CF UB_Omin UB_Omax UB_Pmin UB_Pmax} and line 9 in the fitevalconfig.txt file now becomes,
3 % Take into account observations/model uncertainty (>0,1,2,3 or 4= yes) |
When executing "fiteval fiteval_11s.in" we now obtain,
Using the simplification of a common error distribution type for all predictions and observations, for example a triangular distribution with bounds given as -/+25% of the observed values and -15%/+20% of the predicted value, line 9 in the fitevalconfig.txt file now becomes,
3 11 oT 25 25 pT 15 20 % Take into account observations/model uncertainty (>0,1,2,3 or 4= yes) |
and the input file now must have only 2 columns (Observed vs. predicted values). For example, with the sample file fiteval.in when running "fiteval fiteval.in" and the configuration line 9 as above we would obtain,

Program License
This program is distributed as Freeware/Public Domain under the terms of GNU-License. If the program is found useful the authors ask that acknowledgment is given to its use and to the journal publications behind the work (Ritter and Muñoz-Carpena, 2013, 2020) in any resulting publication and that the authors are notified. The source code is available from the authors upon request:
- Dr. Axel Ritter
Profesor Titular
Ingeniería Agroforestal
Universidad de La Laguna
Ctra. Geneto, 2; 38200 La Laguna (Spain)
Phone: +34 922 318 548
http://aritter.webs.ull.es/
aritter@ull.es
- Dr. Rafael Muñoz-Carpena
Professor, Hydrology & Water Quality
Department of Agricultural & Biological Engineering
University of Florida
P.O. Box 110570
287 Frazier Rogers Hall
Gainesville, FL 32611-0570 (USA)
carpena@ufl.edu
© Copyright 2012 Axel Ritter & Rafael Muñoz-Carpena
References
- Harmel, R.D., Smith, P.K., 2007. Consideration of measurement uncertainty in the evaluation of goodness-of-fit in hydrologic and water quality modeling. J. Hydrol. 337, 326–336.doi: 10.1016/j.jhydrol.2007.01.043
- Harmel, R.D., Smith, P.K., Migliaccio, K.W., 2010. Modifying goodness-of-fit indicators to incorporate both measurement and model uncertainty in model calibration and validation. Trans. ASABE 53:55–63. doi: 10.13031/2013.29502
- Harmel, R.D., P.K. Smith, K.W. Migliaccio, I. Chaubey, K.R. Douglas-Mankin, B. Benham, S. Shukla, R. Muñoz-Carpena, B.J. Robson. 2014. Evaluating, interpreting, and communicating performance of hydrologic/water quality models considering intended use: A review and recommendations. Env. Mod. & Soft. 57:40-51. doi:10.1016/j.envsoft.2014.02.013
- Ritter, A. and R. Muñoz-Carpena. 2020. Integrated effects of data and model uncertainties on the objective evaluation of model goodness-of-fit with statistical significance testing (under review).
- Ritter, A. and R. Muñoz-Carpena. 2013. Predictive ability of hydrological models: objective assessment of goodness-of-fit with statistical significance. J. of Hydrology 480(1):33-45. doi:10.1016/j.jhydrol.2012.12.004
This page was last updated on June 24, 2025.