Current and Future Habitat Suitability Maps at Multiple Scales and Resolutions via Niche-based Species Distribution Models
Matteo Convertino (University of Florida, ABE Dept. - IFAS)
In order to derive habitat suitability maps (HSMs), that describe the probability of occurrence of birds, different species distribution models have been used. Species distribution models (SDMs) are numerical tools that combine observations of species occurrence/absences or abundance with environmental layers. They are used to gain ecological and evolutionary insights and to predict distributions across landscapes, sometimes requiring extrapolation in space and time. SDMs are now widely used across terrestrial, freshwater, and marine realms. There is currently a strong debate in the scientific community about the comparison of many different niche-based species distribution models, and in comparing these niche-deductive based models with mechanistic dispersal-based or niche based models.
The predictive habitat suitability models used are MaxEnt and GARP mainly, the latter through the openModeller platform. Therefore the study will focus also on the comparison with other possible methods. The AUC - ROC method has been selected as main indicator of the goodness of the models.
Focus has been posed on Snowy and Piping Plovers, the former resident birds in Florida, the latter are migratory wintering birds. Snowy Plovers are mainly present in the beach class. The extreme long and narrow habitat area of plovers (composed mainly by barrier island and narrow strips of shorelines) makes unique and at the same time not easy the study. The home range of Snowy Plovers is ~ 120 km (evaluated for Snowy Plovers of the Pacific Coast) so the buffer zone considered around the occurrences points is not really large (1000 meter maximum).
It is found that the habitat suitability function is scale and resolution dependent. Simulations have been conducted for the coupled north and gulf coasts populations, for the north and gulf coasts populations disjoined, and for the Tyndall and Eglin Air Forces bases populations in order to fit and validate the model and to perform an analysis at different scale.
The development of a stand-alone optimal code of a spatial distribution model that can be coupled to the geomorpholgical model SLAMM and to the metapopulation model RAMAS-GIS is the final task. HSMs can then be generated in time taking the spatial variation. Other analysis will be welcomed, such as the detection of other relevant patterns (abundances vs latitude), estimation of interactions between individual or among species via clustering analysis, or estimation of abundance data from occurrence data.
The evaluation of the uncertainty effects on GPS locations of birds, location of introduced artificial absences, and error in assigning land cover to the presences will be evaluated perturbing the environmental and biological maps (e.g. land cover and presences respectively) and running the SDMs with the perturbed map. The comparison between the outputs (HSMs) of the SDMs with current and perturbed environmental layers will provide an assessment of uncertainty.

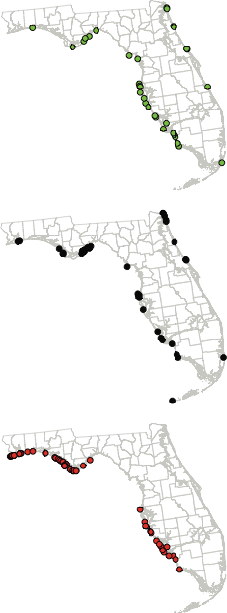
Figure 1. Spatial patterns for the distribution of the occurrence of Red Knots (RK), Piping Plovers (PP),
and Snowy Plovers (SP) (from top to the bottom, green, black and red dots respectively)
for the wintering (RK and PP) and nesting census (SP), 2006 by IPPC.

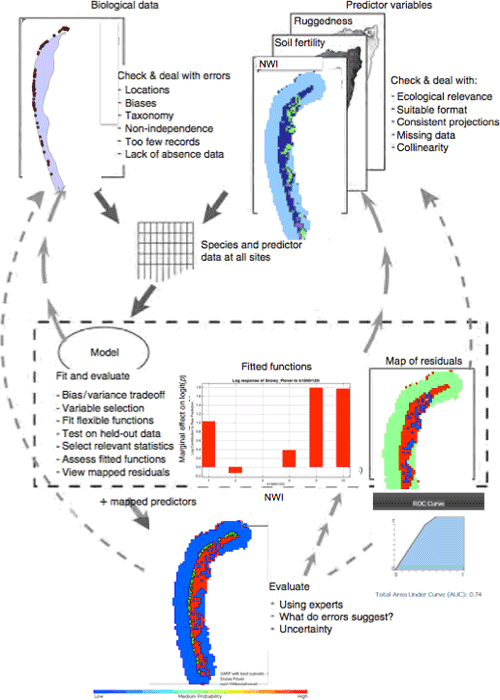
Figure 2. Schematic representation of a Species Distribution Model. Regardless of the model used
the underlining framework of this deductive niche-based model is the same. Biological point
presences/absences data are the inputs, environmental layers are the predictors, and the
resulting output is a map of probabilities of occurrences called "habitat suitability map".

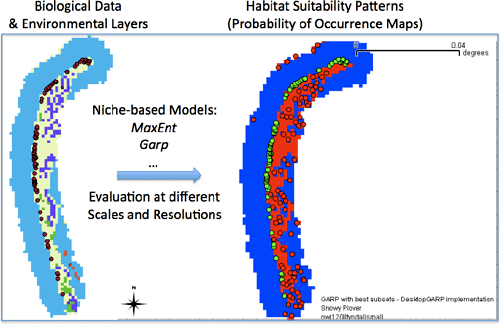
Figure 3. Example of Habitat Suitability Map (HSM, on the right) in which the probability of occurrence
is binary (0=blue or 1=red), derived considering the NWI categories (categorical variable) for a
portion of barrier island in from of the Tyndall Air Force Base, Florida (Panhandle region) with the
GARP-best subset method. On the HSM the green dots are the presences location while the red
dots are artificial absences added in the model.

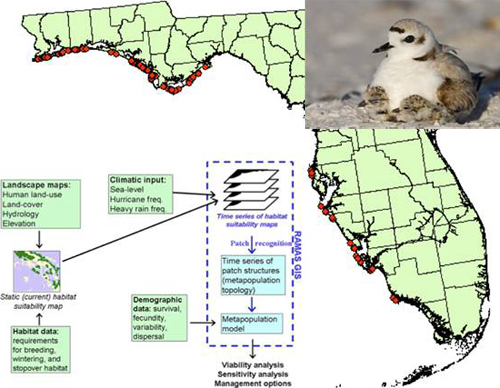
Figure 4. Approach adopted in the project in which the current environmental layers (e.g. land cover,
land use, vegetation, sea-level, mean annual rainfall) produce the current habitat suitability map
through the spatial distribution models. Projections of environmental layers in the future (scenarios
2060 and 2100 are key scenarios), e.g. land cover determined by SLAMM, produce projected habitat
suitability maps that RAMAS takes in as input. The metapopulation model predicts then the variation
of shoreline birds in time.
This page was last updated on July 13, 2019.